

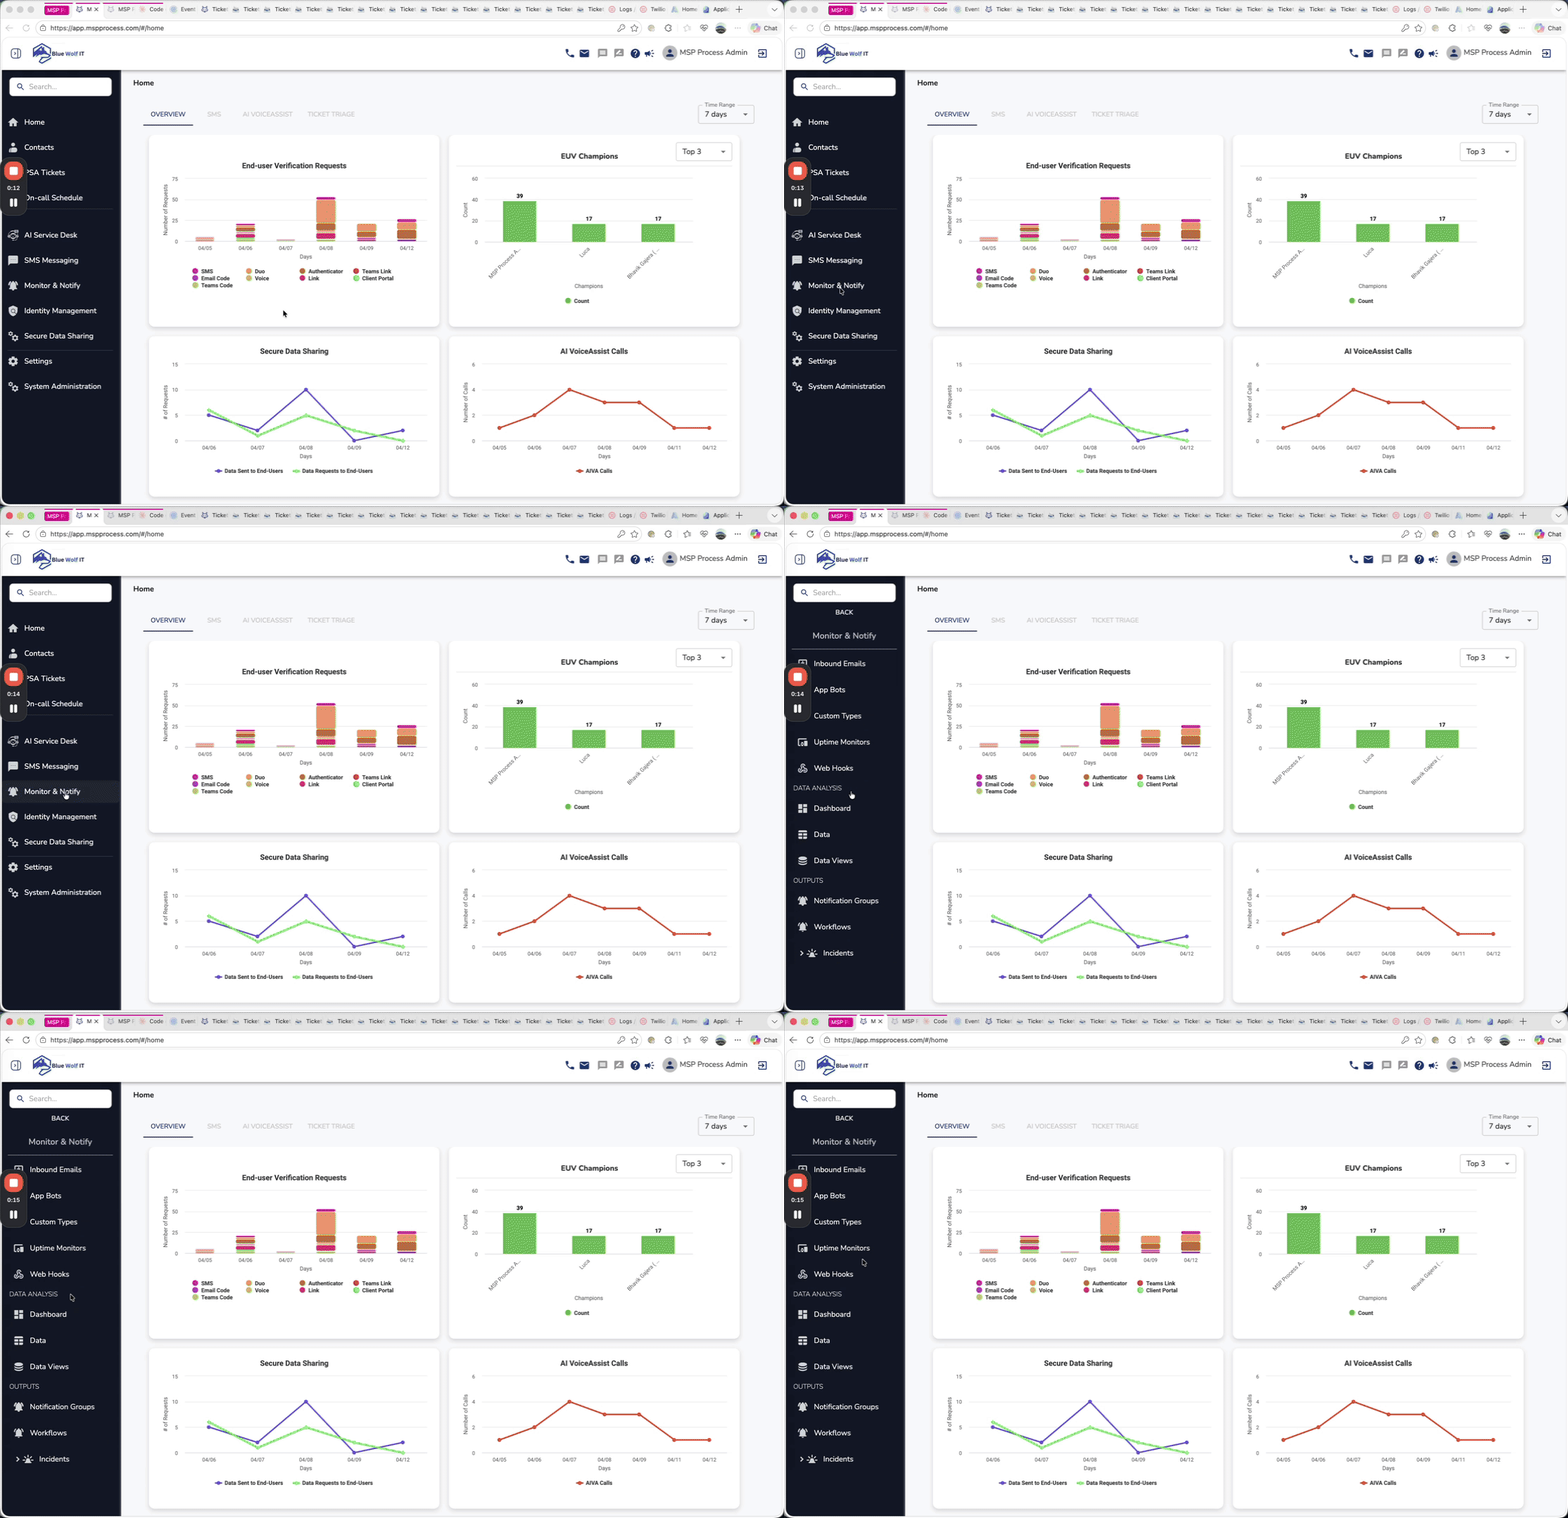
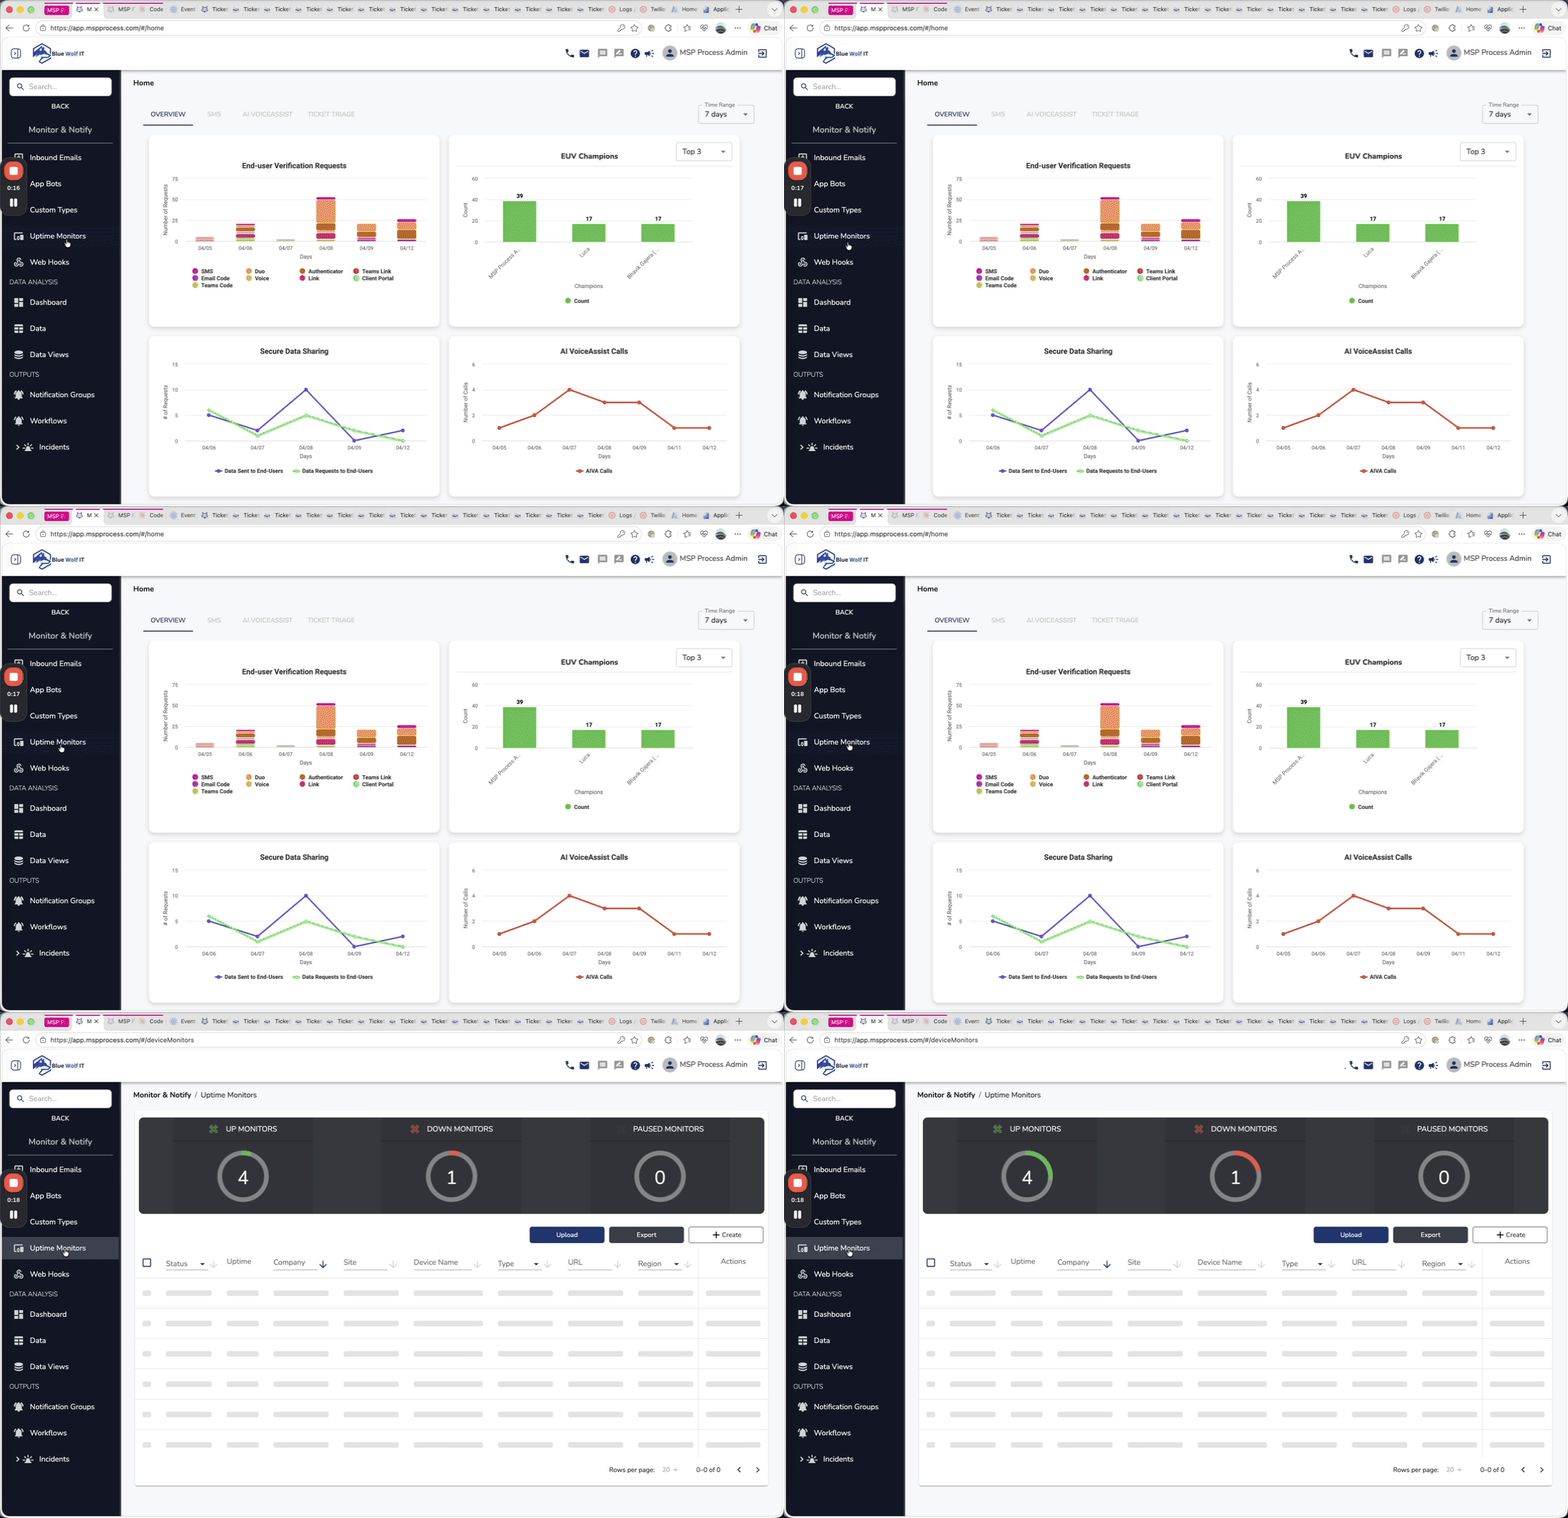
Where to find Uptime Monitors
- In MSP Process, open the Monitor & Notify menu from the left sidebar.
- Select Uptime Monitors.
Create a new uptime monitor
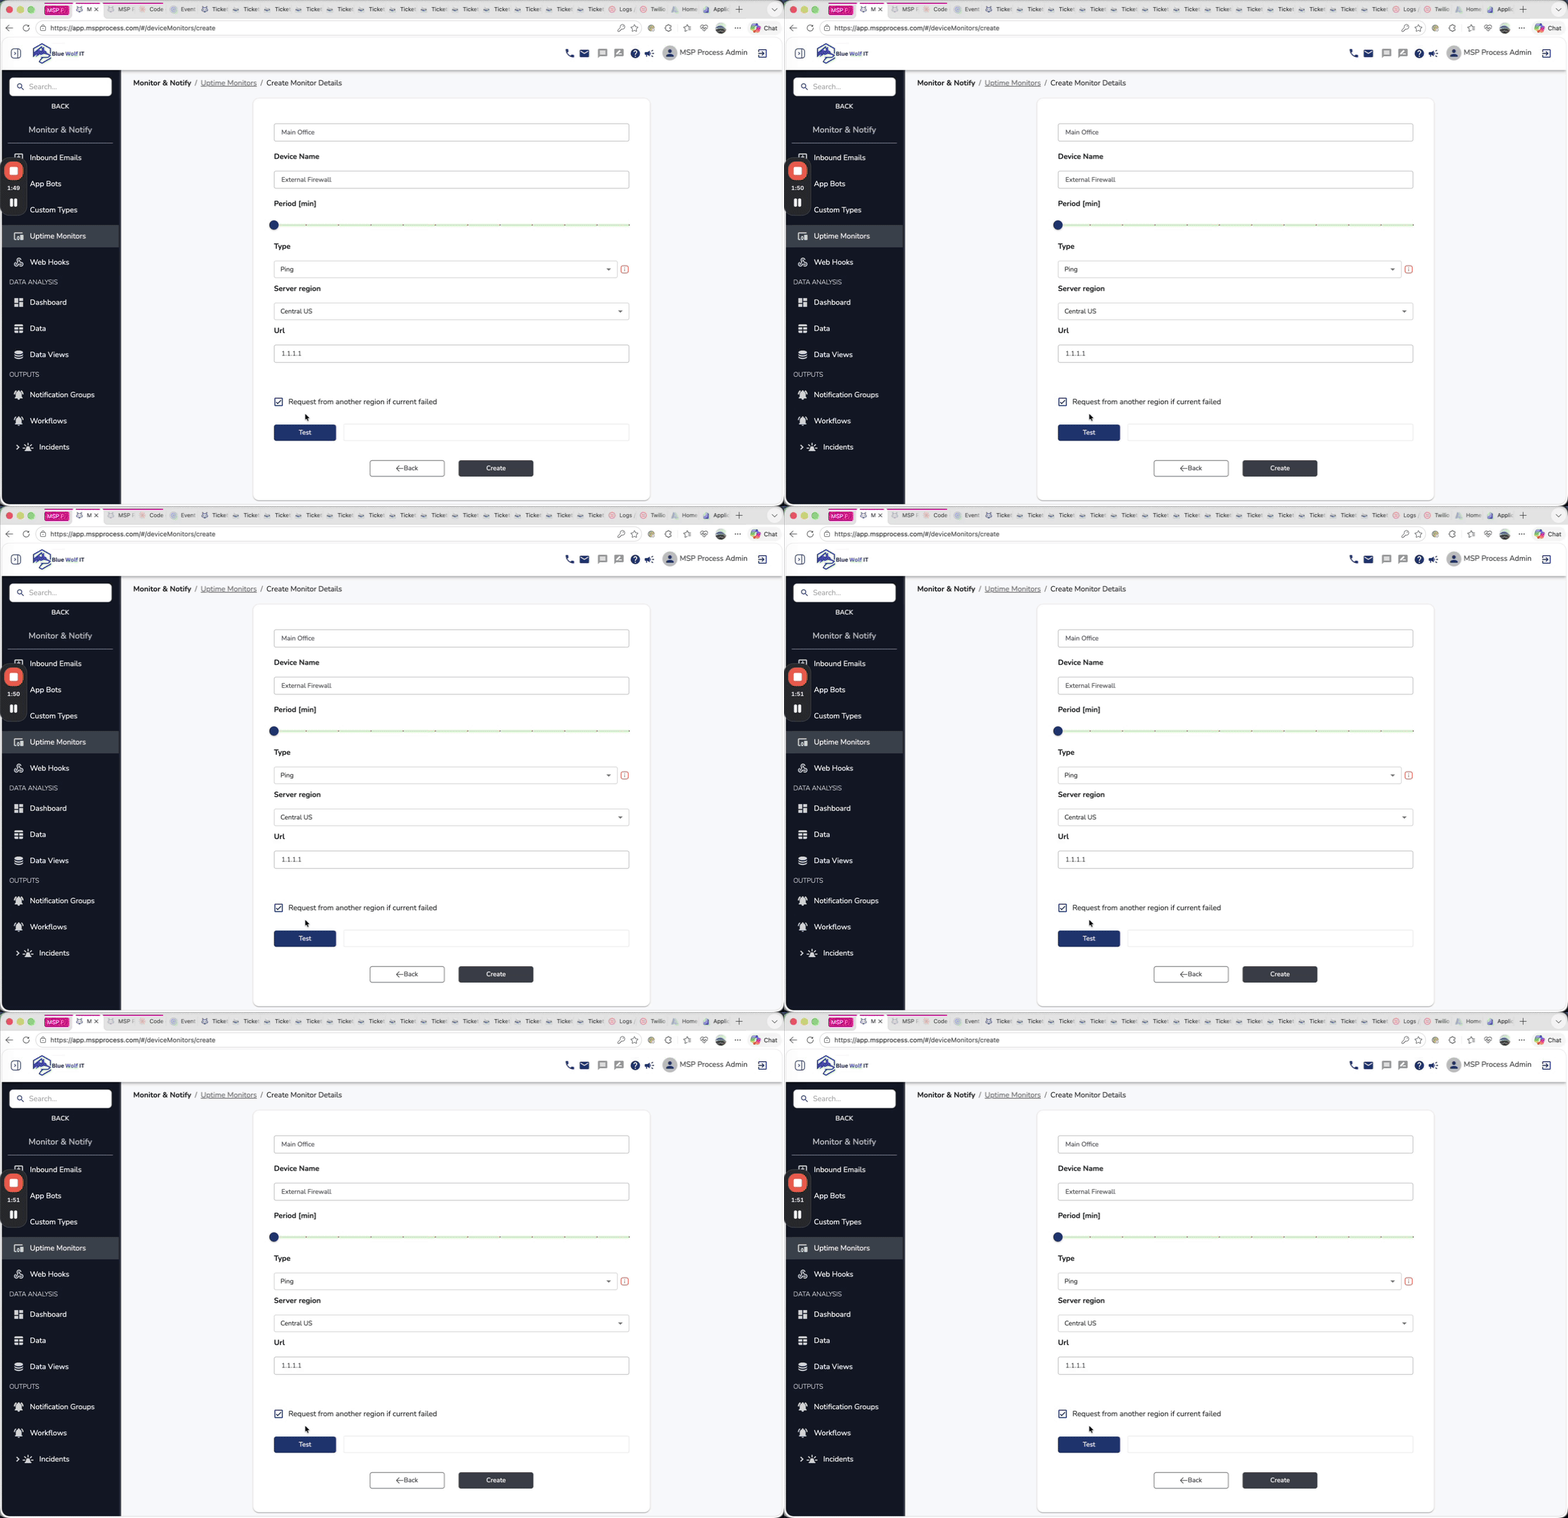
Creating a monitor is straightforward. You can assign it to a company, optionally enter a site, choose the scan interval, define the scan type, and specify which Azure region should perform the check.- From the Uptime Monitors page, click + Create.
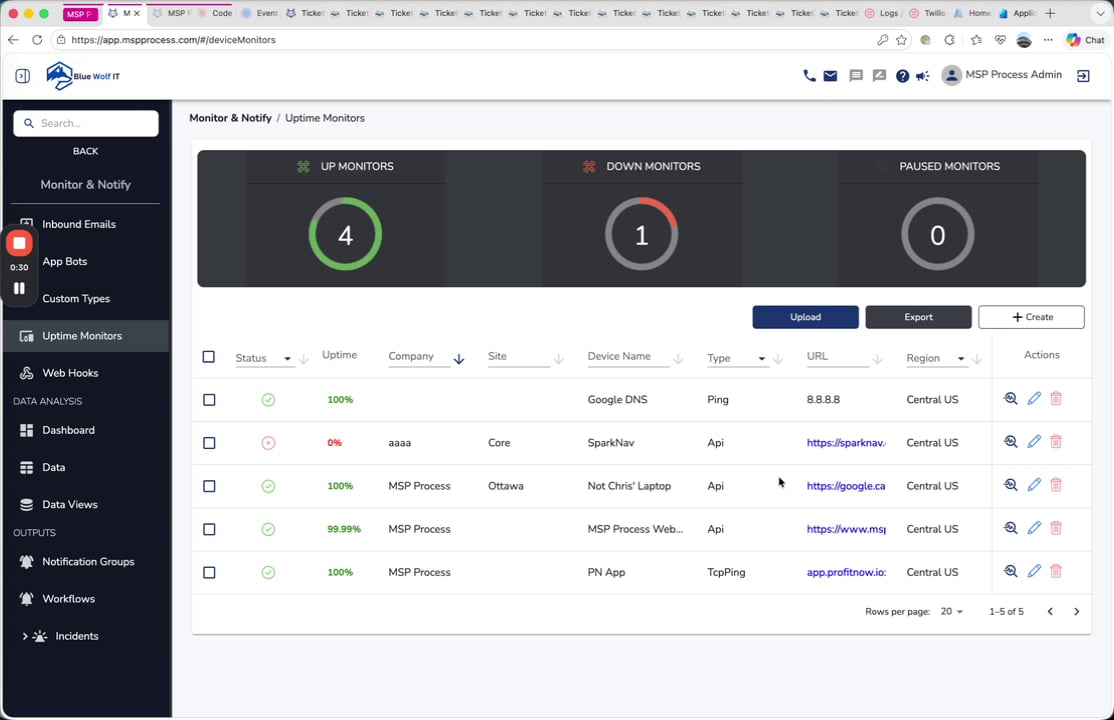
- Select the Local Company the monitor should belong to - you’ll set those up under the AI Service Desk -> Ticketing -> Company Mapping page.
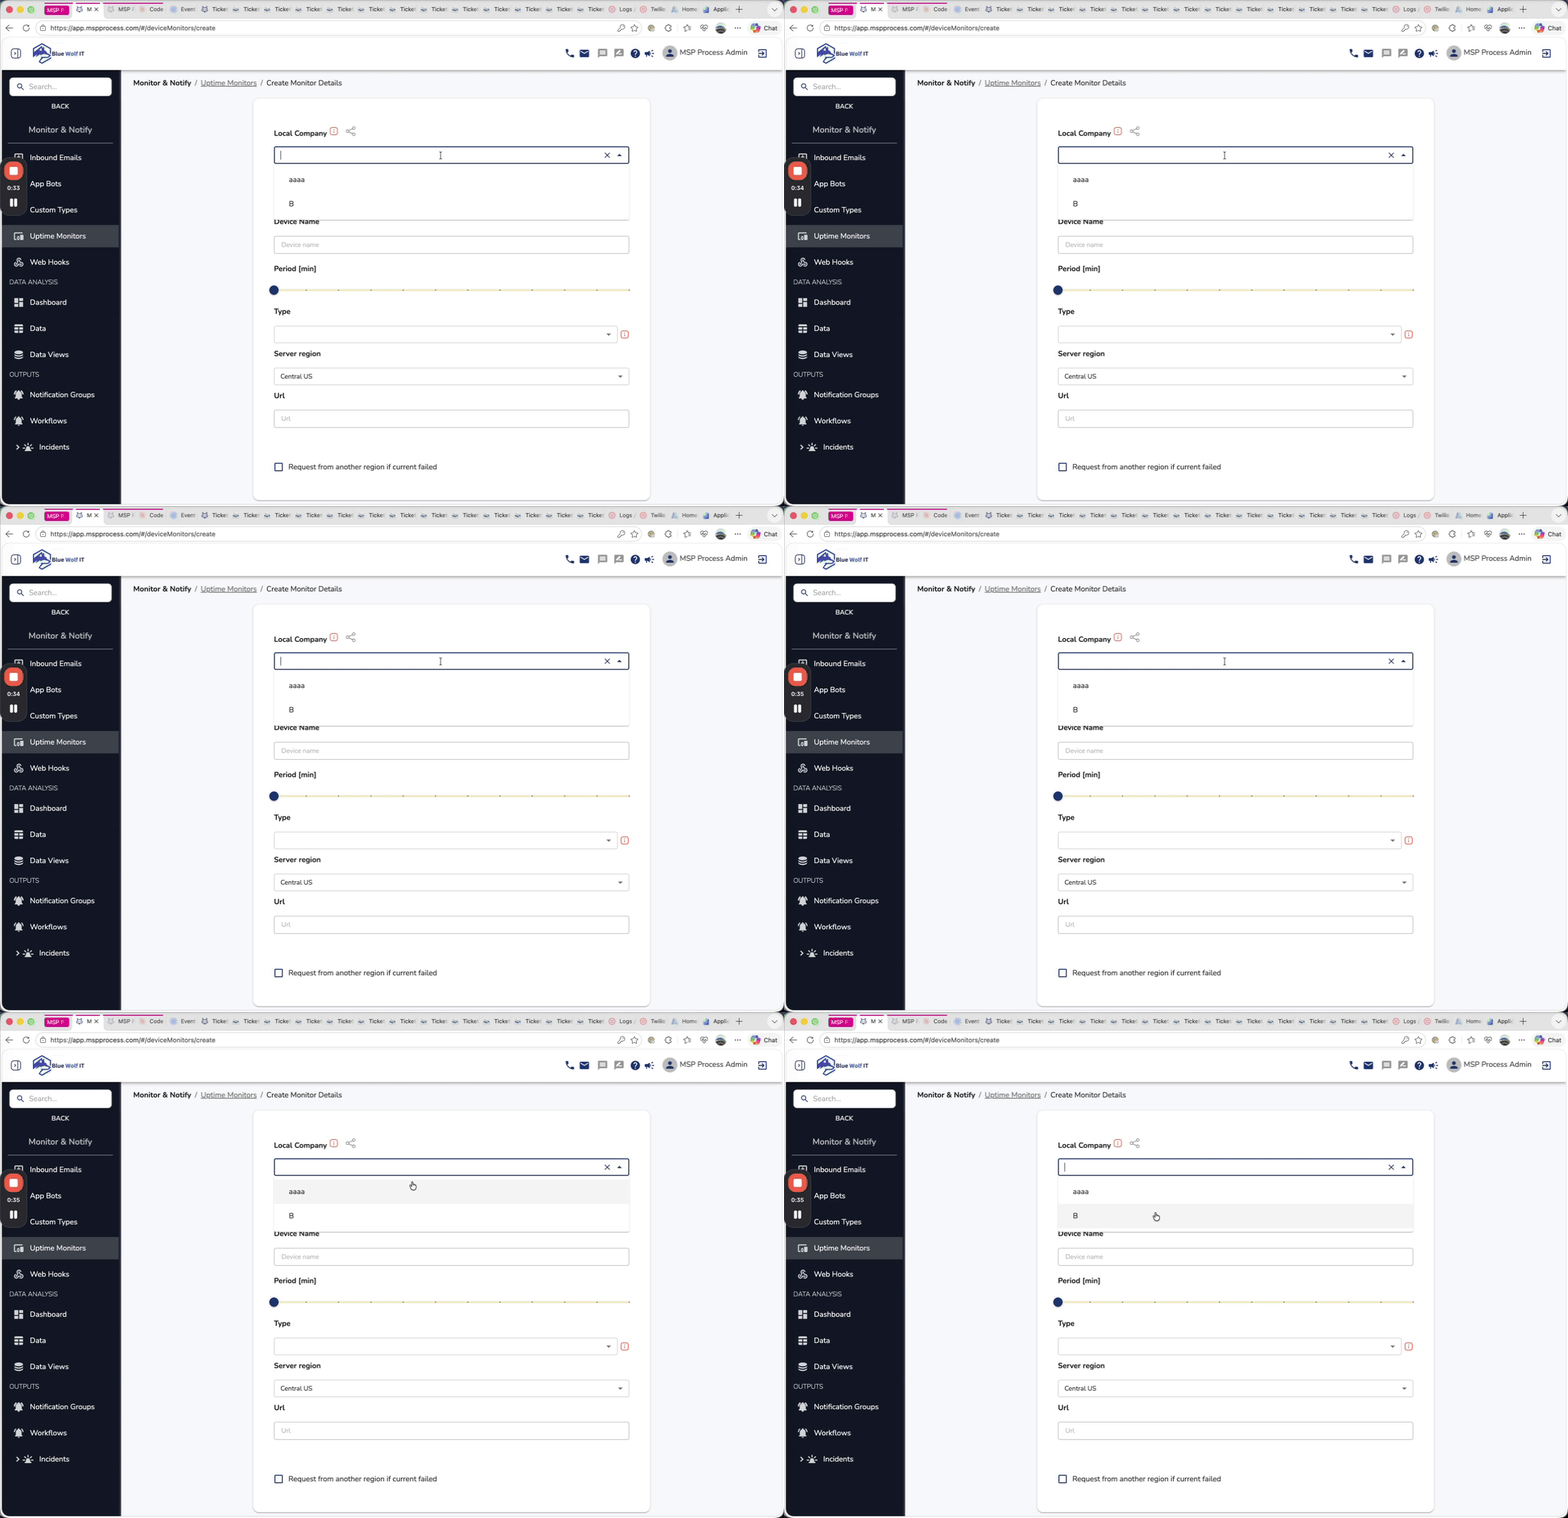
- Optionally enter a Site, such as Main Office.
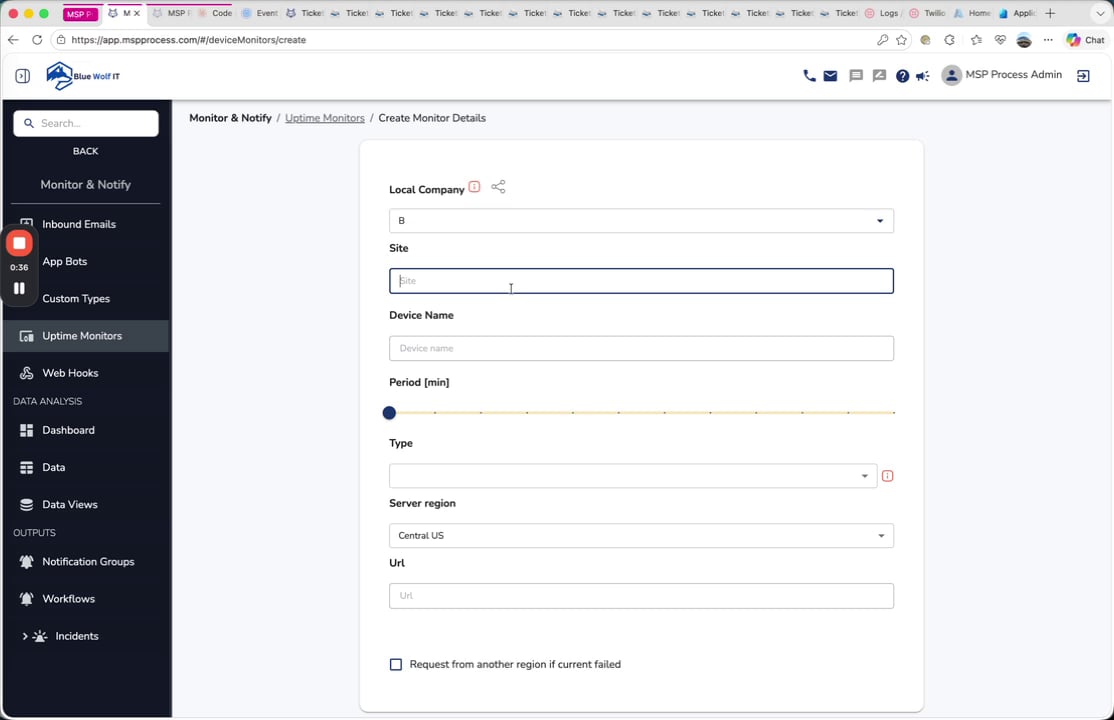
- Enter a descriptive Device Name, such as External Firewall.
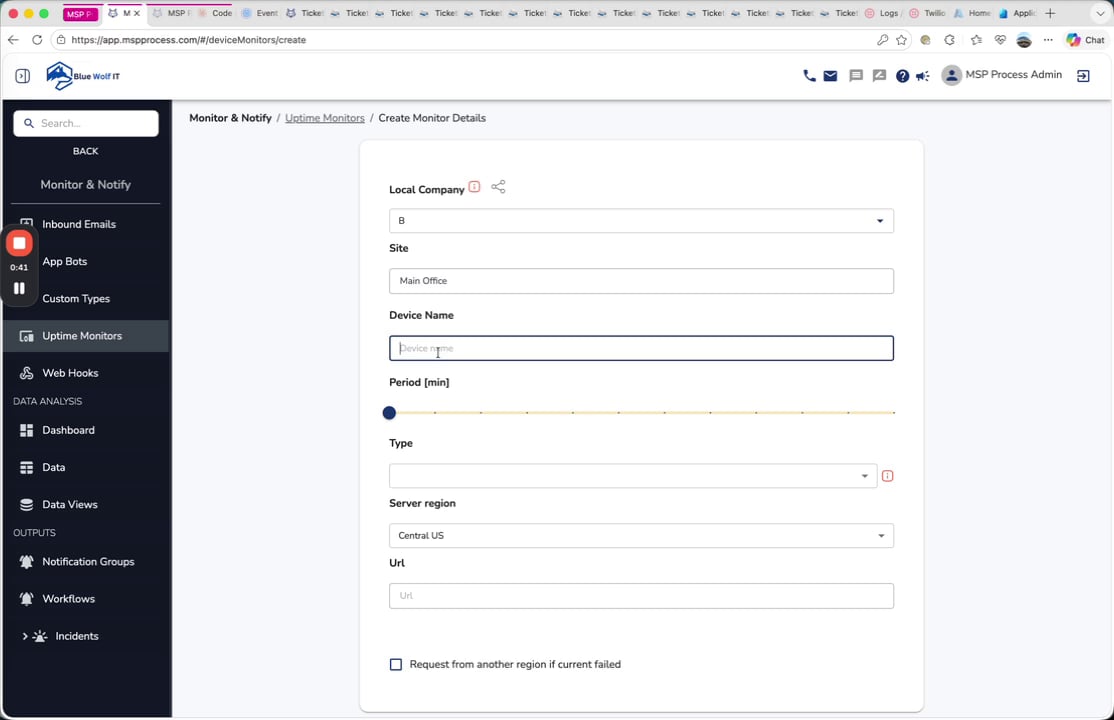
- Choose the Period [min] for how often the monitor should run. The default (and minimum) interval is 5 minutes.
- Select the Type of check you want to perform.
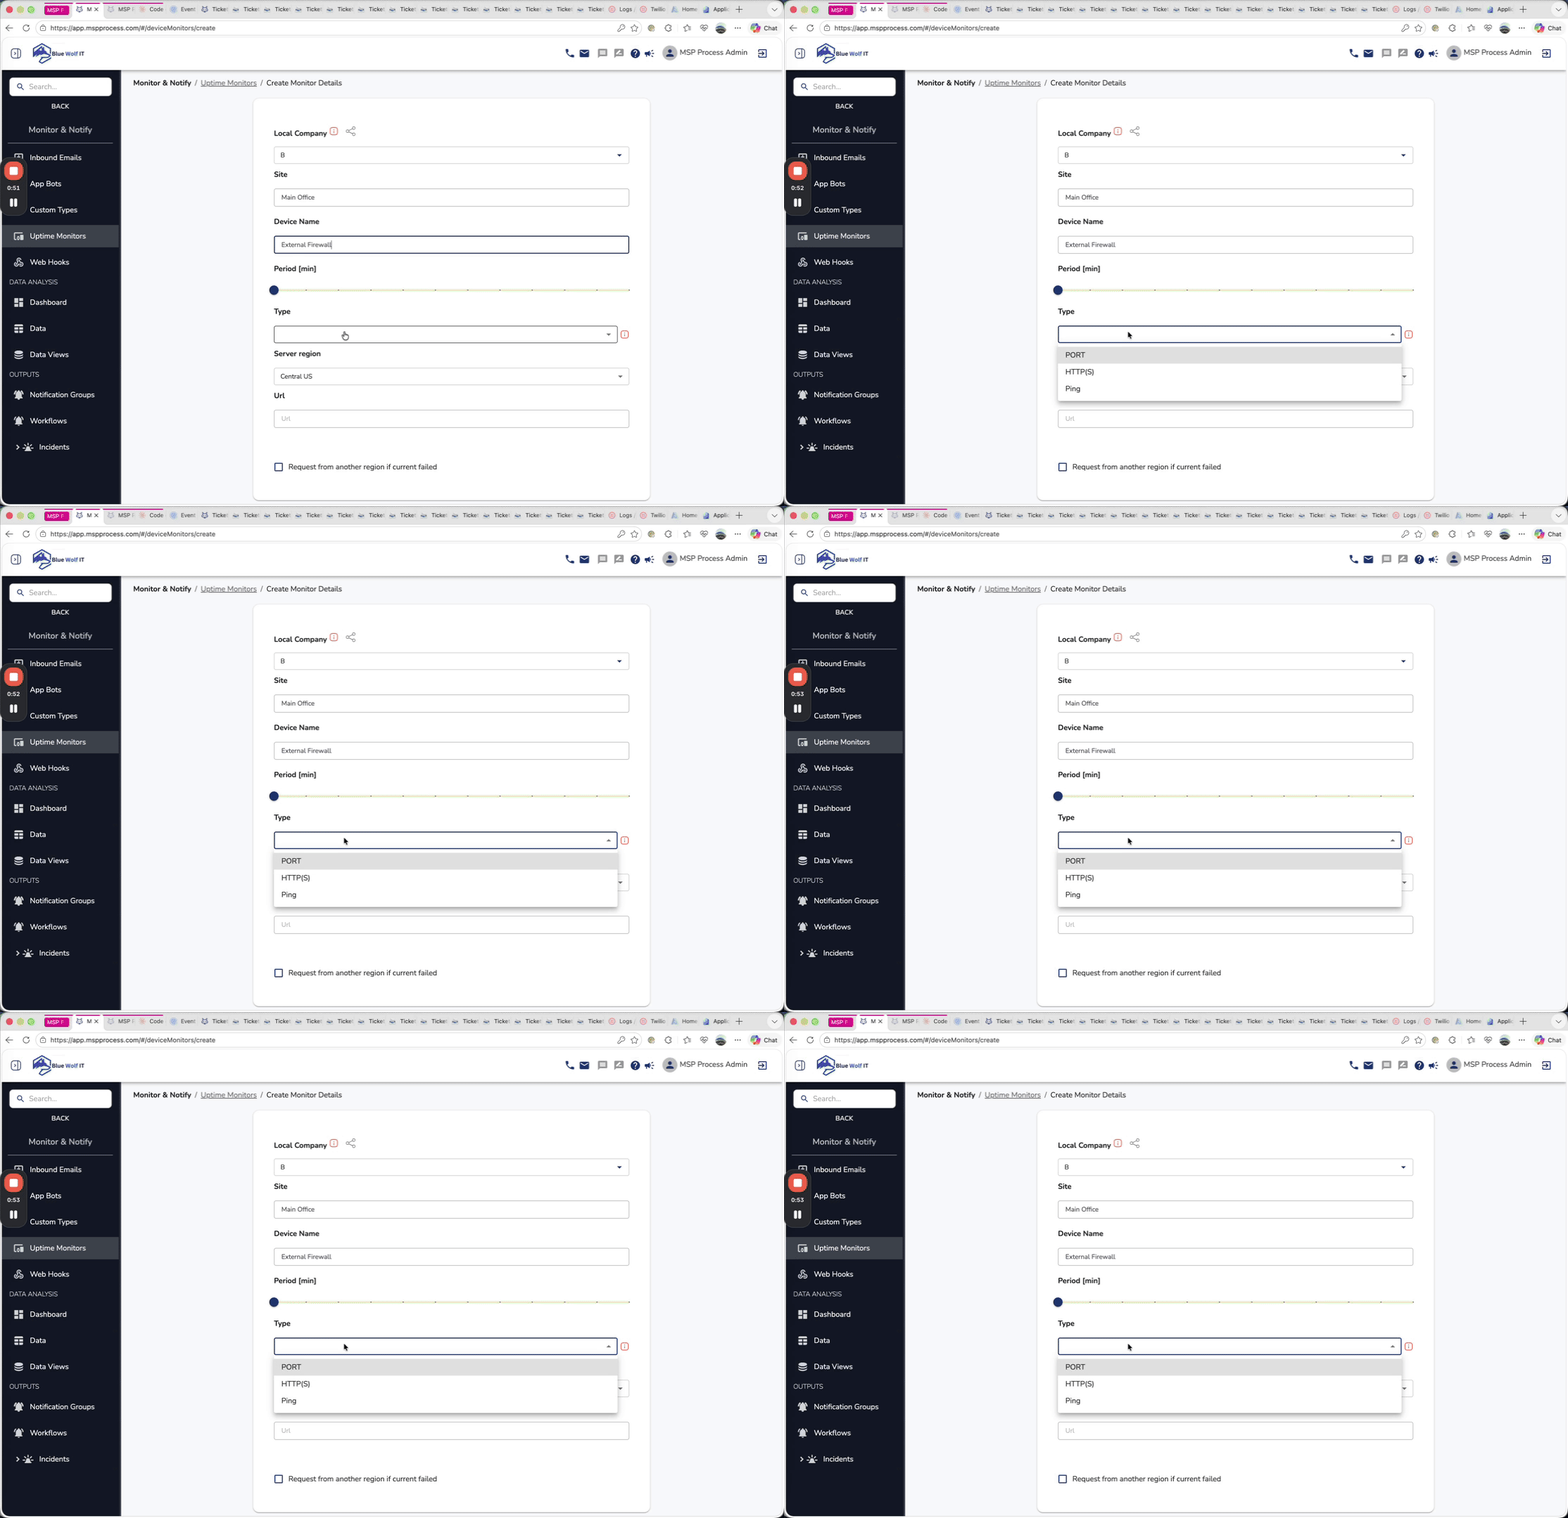
Available monitor types
MSP Process supports several ways to test external availability, depending on what you need to monitor.- Port checks for common services such as HTTP, HTTPS, FTP, SMTP, POP3, and IMAP
- Custom port checks for other externally exposed services
- HTTPS checks for web endpoints
- Ping for basic reachability testing
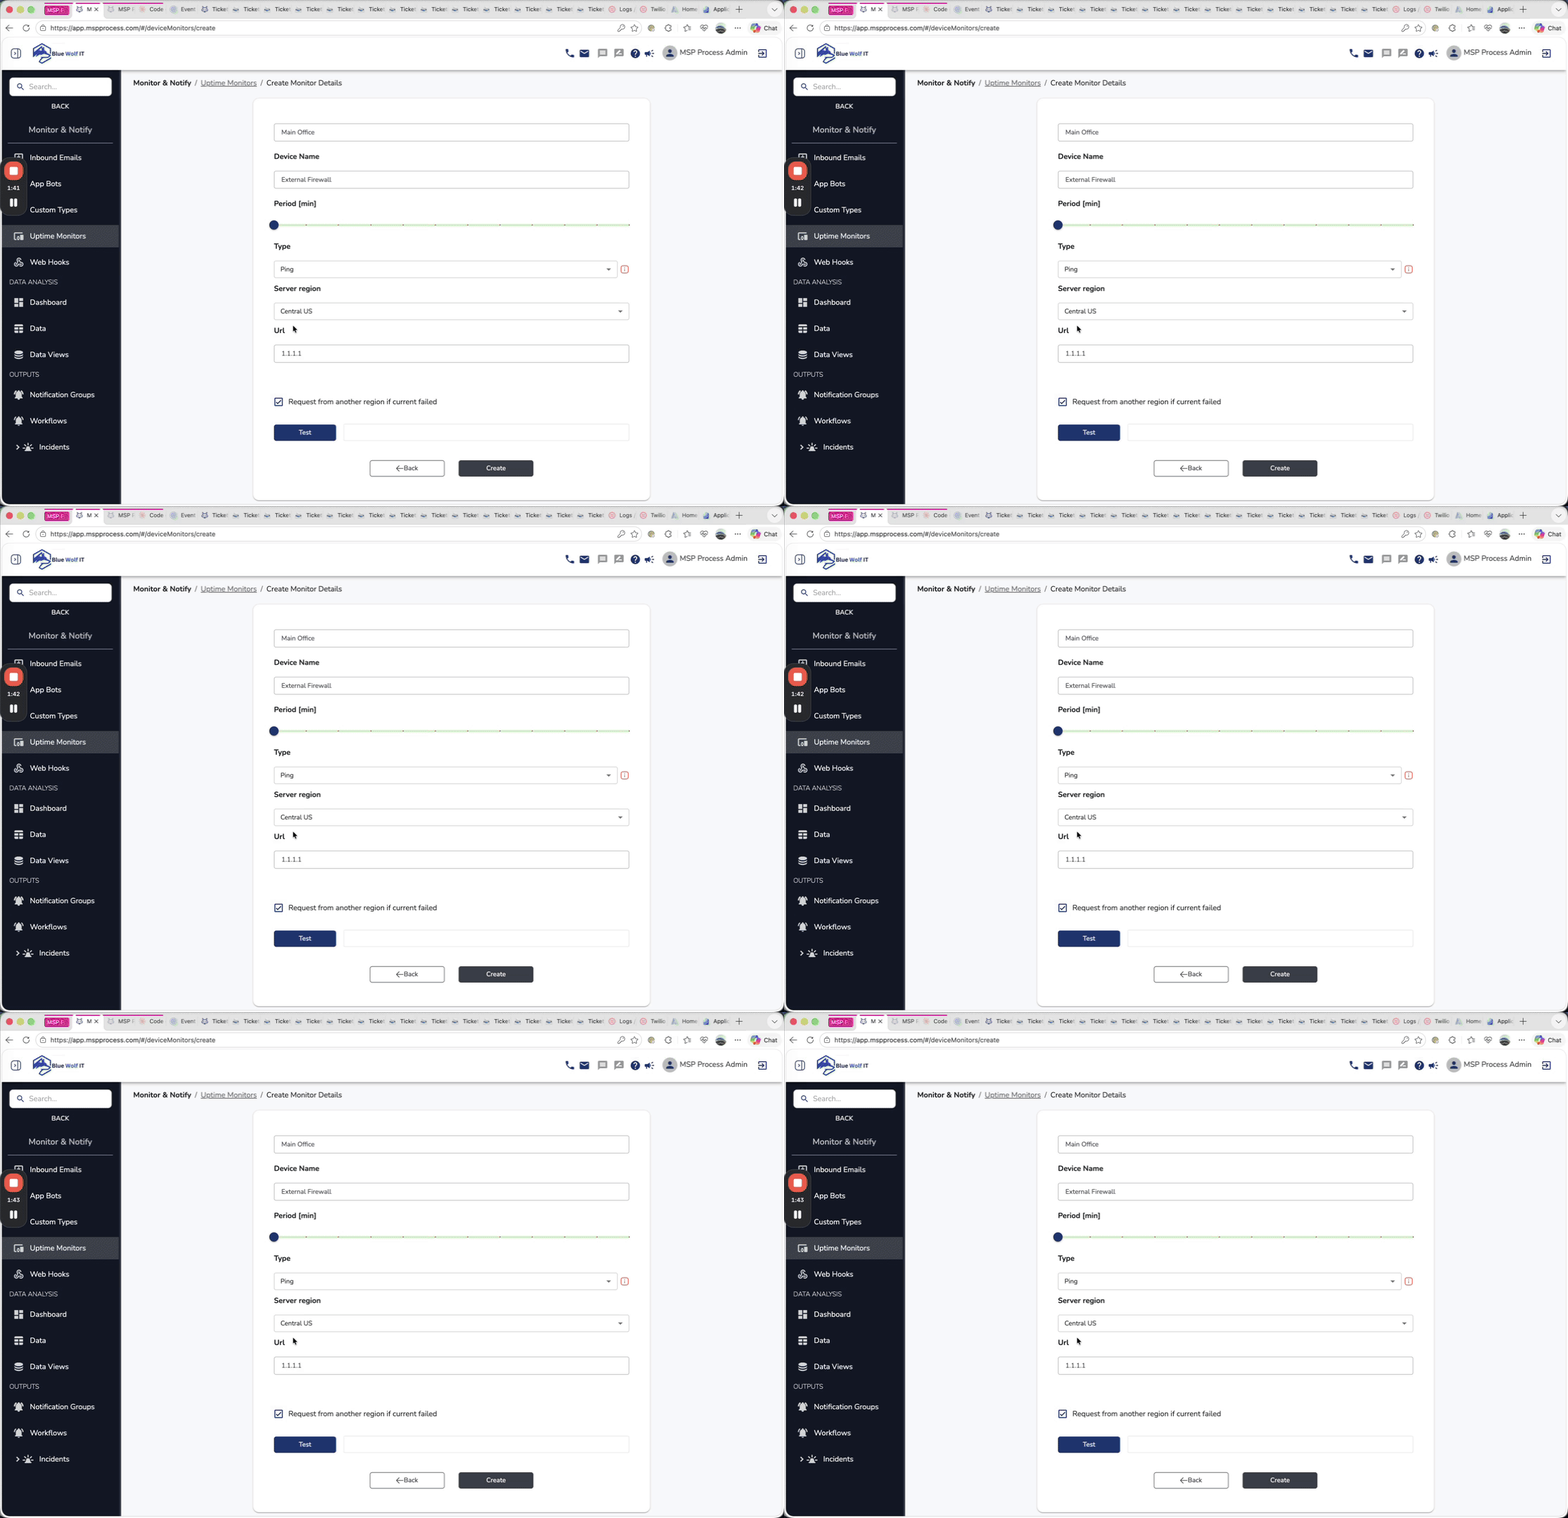
Choose the scan region and target
After selecting the monitor type, choose where the check should originate and enter the public target you want to monitor.- Select the Server region. MSP Process provides scanning probes in:
- Central US (Azure)
- Western Europe (Azure)
- Enter the public IP address or FQDN in the URL field.
- If desired, enable Request from another region if current failed so MSP Process can retry the check from the alternate region when the primary region fails.
Test and create the monitor
- Click Test to validate the settings and confirm the target responds as expected.
- Once the test looks correct, click Create.
Bulk import monitors with CSV
If you need to create many monitors at once, you can use the Upload option on the Uptime Monitors page to import them in bulk.- Download the provided CSV template
- Populate the file with your monitor details
- Upload the completed CSV to create multiple monitors at once
View monitor results and status history
After monitors are created, you can review their status from the Uptime Monitors list. Click the magnifying glass icon for a monitor to open a detailed view showing:- Current status
- Uptime percentage
- Recent events
- Historical availability information
- How frequently outages or recoveries have occurred
Use TV Mode for NOC displays
If you want to display uptime information on a wallboard or NOC screen, you can switch the detailed monitor view into TV Mode. This mode automatically refreshes and provides an at-a-glance dashboard for ongoing monitoring.Getting Notified When an Uptime Monitor Fails
When an Uptime Monitor fails, you can configure MSP Process to generate a ticket in your PSA, and/or send out an Email, SMS, Voice, Slack or Microsoft Teams alert. To get started, go to the Monitor & Notify -> Workflows page, and then click on the Uptime Monitor Workflows tab: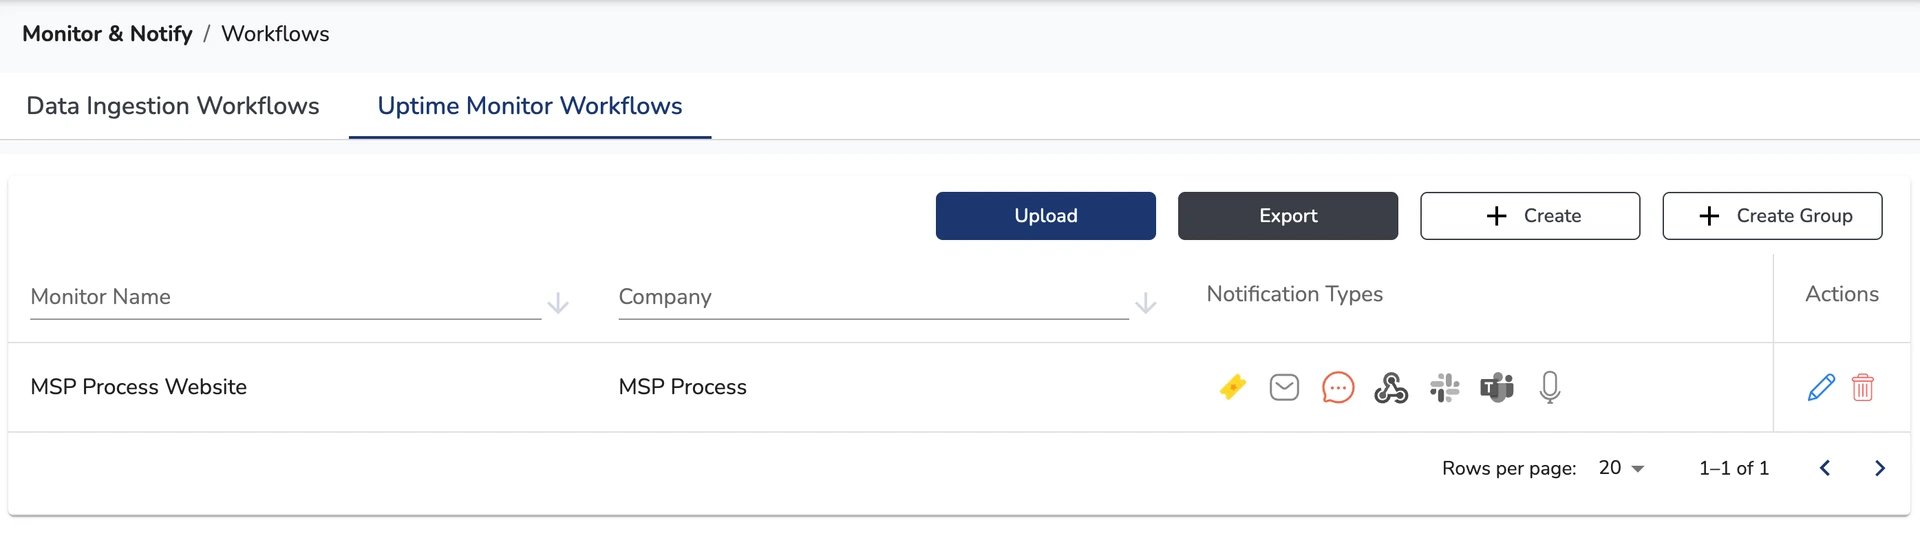
- To get notified on a specified Uptime Monitor, click the Create button
- To get notified on all of the Uptime Monitors within a Company, click the Create Group button
Tips and best practices
- Use clear, descriptive monitor names so technicians can quickly identify the asset being tested.
- Assign monitors to the correct company and site for easier reporting and filtering.
- Use Ping for simple reachability checks and Port or HTTPS checks when you need to verify a specific service.
- Enable the Request from another’s region retry when you want additional confirmation of an outage.
- Use CSV import for larger deployments.